Overview
Matplotlib这个库对比起D3.js, Google chart之类的前端可视化工具来说, 美观度和交互性都有所欠缺, 但是对于学术类的图片, 前两个显的太浮夸. 这时候就需要适当调整Matplotlib, 使得绘图不那么古板.
字体
matplotlib中最蛋疼的东西大概就是字体了,主要的问题在中文的支持问题,还有字体格式的问题。
字体列表:
在默认情况下,中文字体会显示成框框:
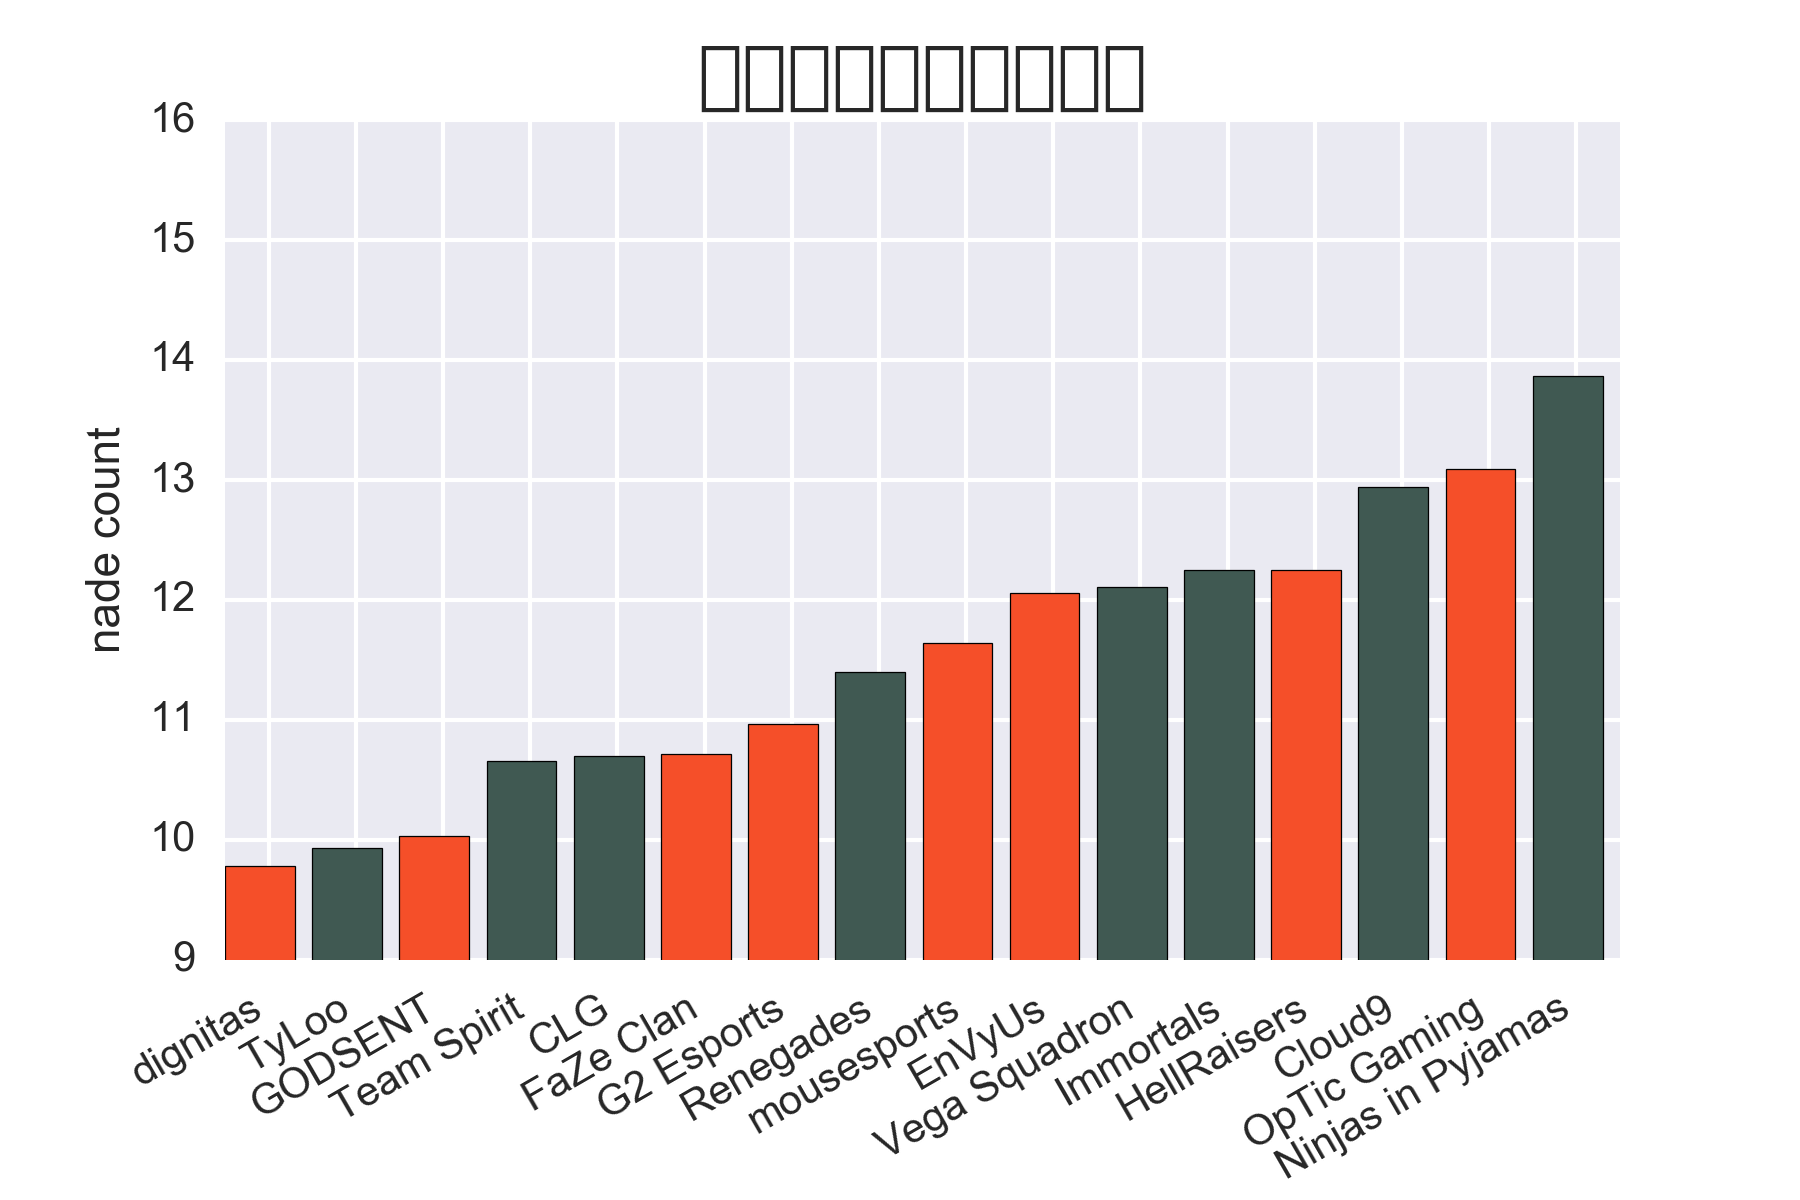
每局购买投掷物的数量 直接变成了10个框框,这时最简单的方法就是直接指定字体了。
那么,有什么字体可以用?网络上可以找到一些简单的方案:
就可以看到这样一个字体列表: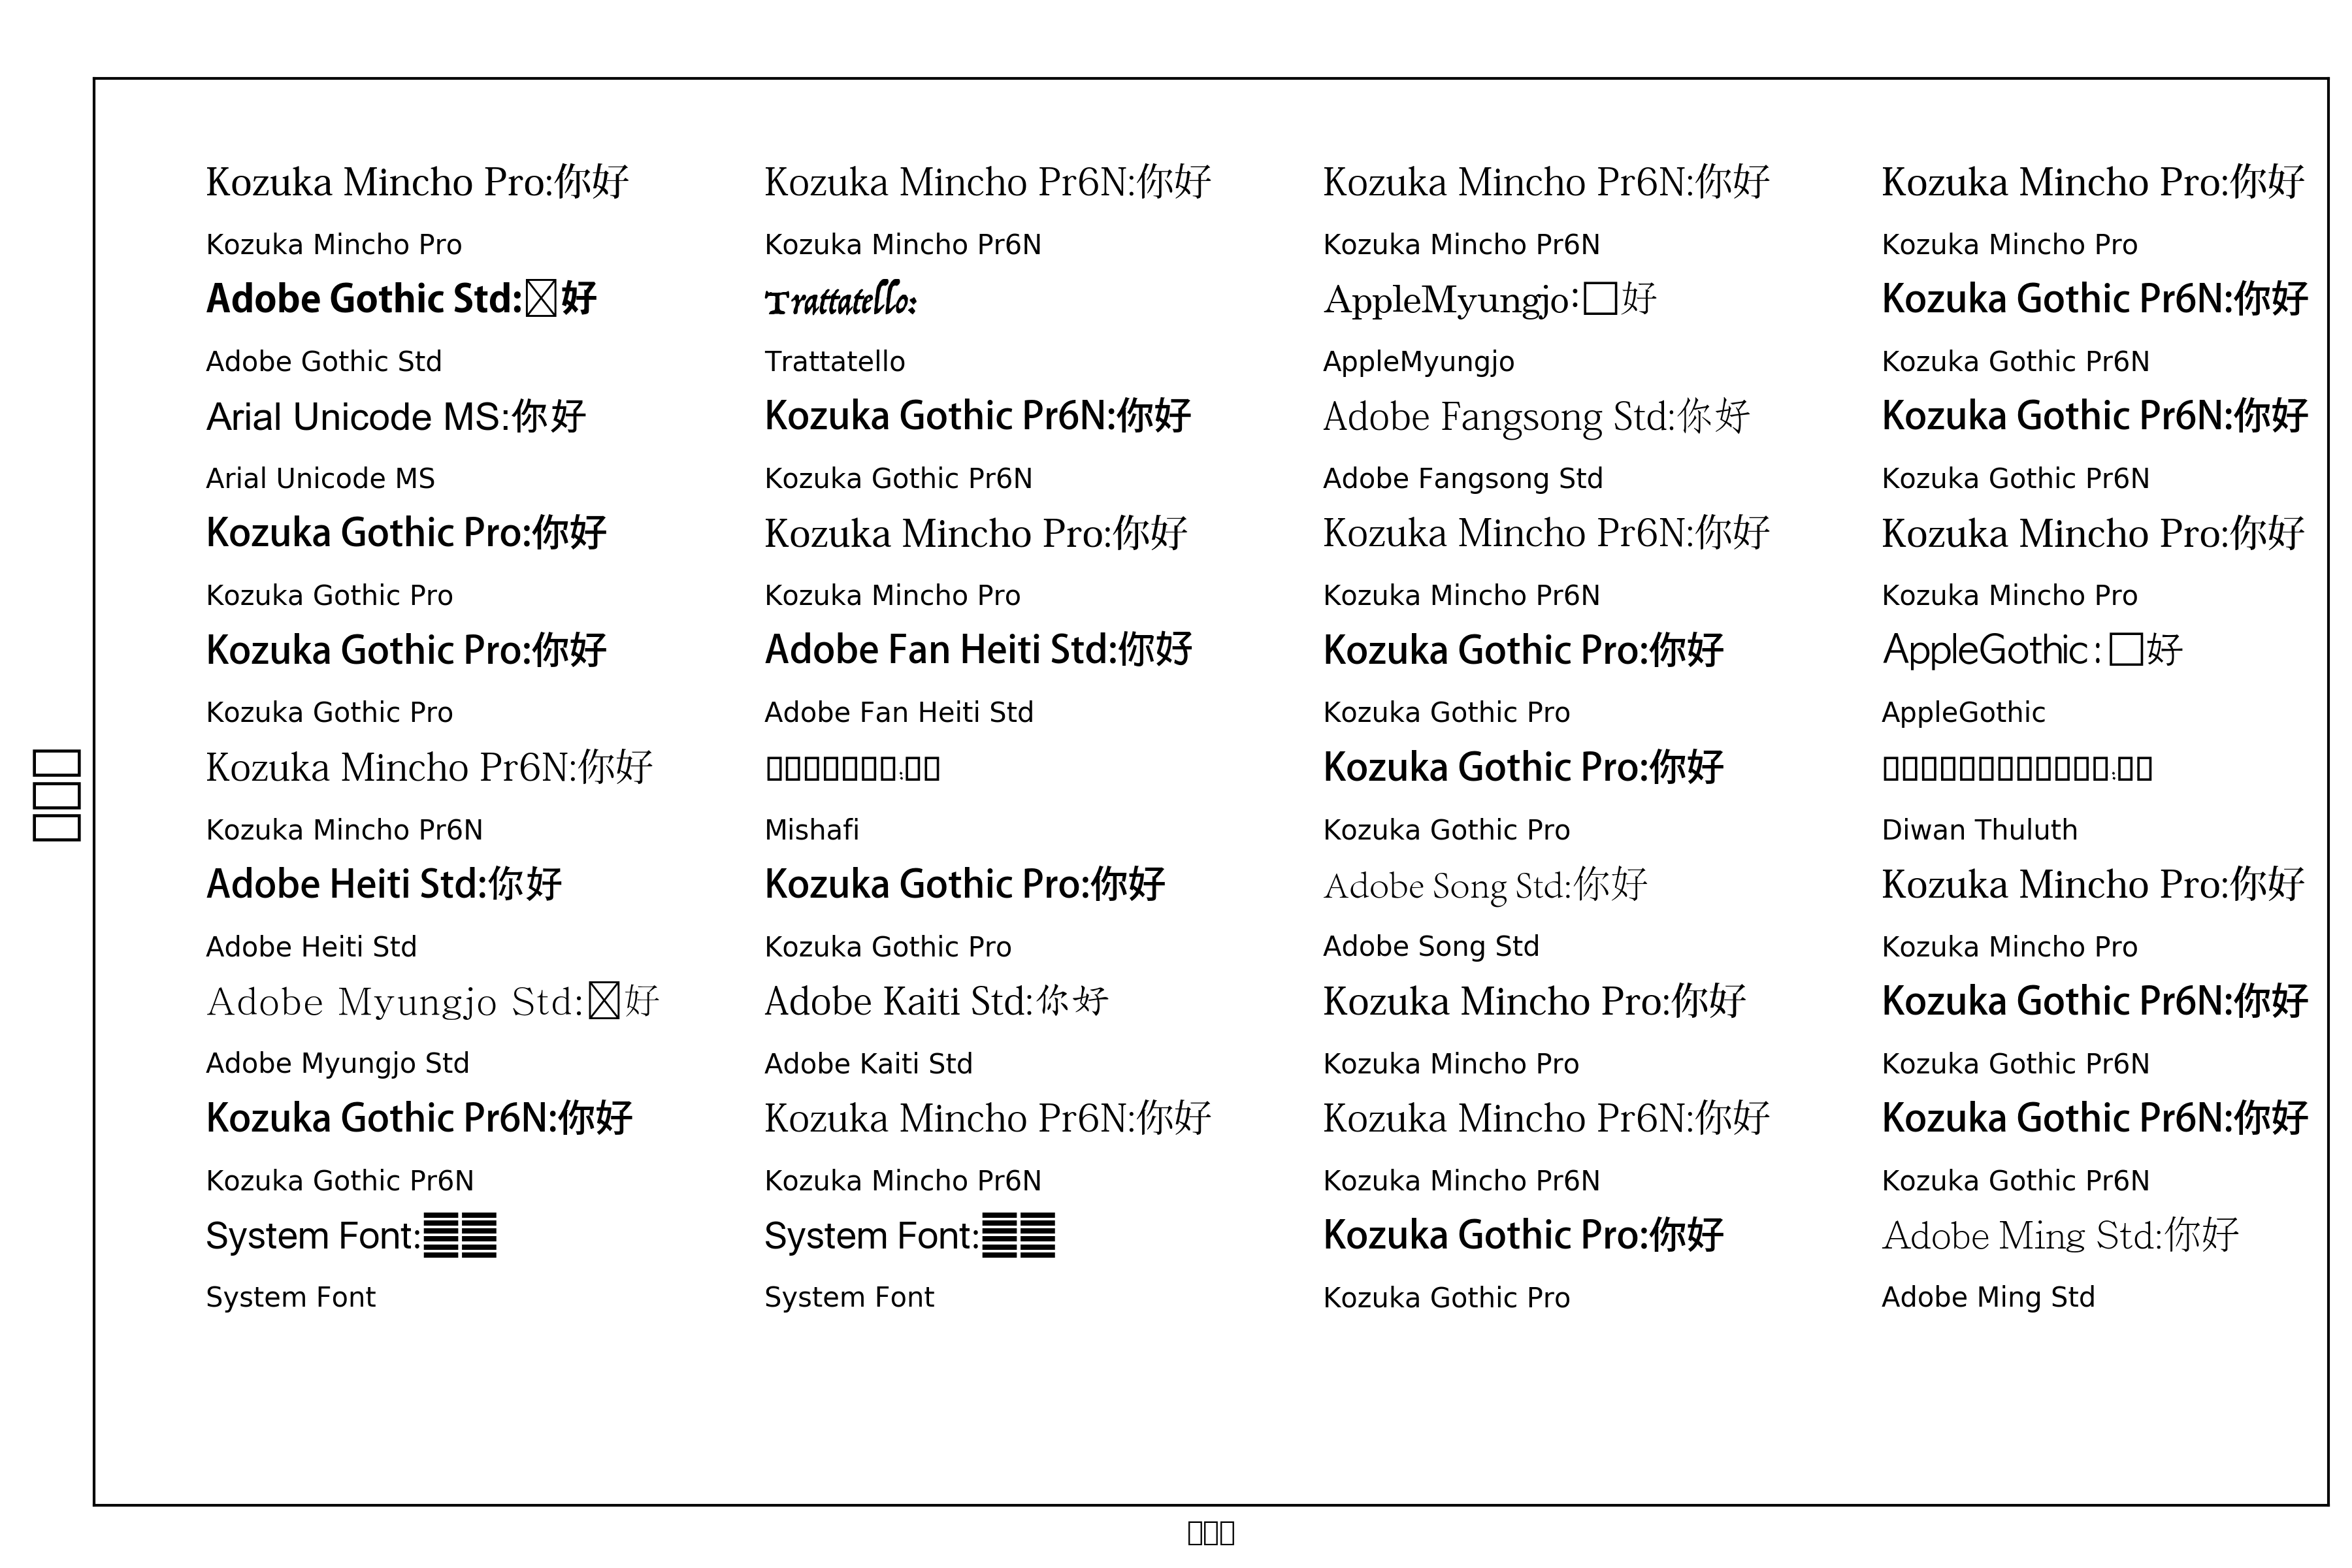
嗯,虽然看上去不太和谐,但总算有个列表里,可是里面的东西为什么这么奇怪!
其实我只想要一个科学的中文字体和一个等宽字体!?
为什么列表里面没有PingFang SC?
Googling….
嗯,这里只是ttf格式的字体,不包括ttc或者otf的字体~ 那只好手动加载了。
macOS 上的字体文件夹的位置
比如说我要的PingFang SC就在/系统/资源库/Fonts/下面.
手动加载字体
目标:使用PingFang SC作为title的字体.
Googling …
很简单,font_manager 提供加载类
然后在需要用到的时候, 指定一下,就可以了:
对于大部分童鞋,应该都可以确定想要用的字体,或者在PS,Sketch上面试一下,找到合适的
这样就可以替换掉之前存在的框框了~
使用PingFang SC的title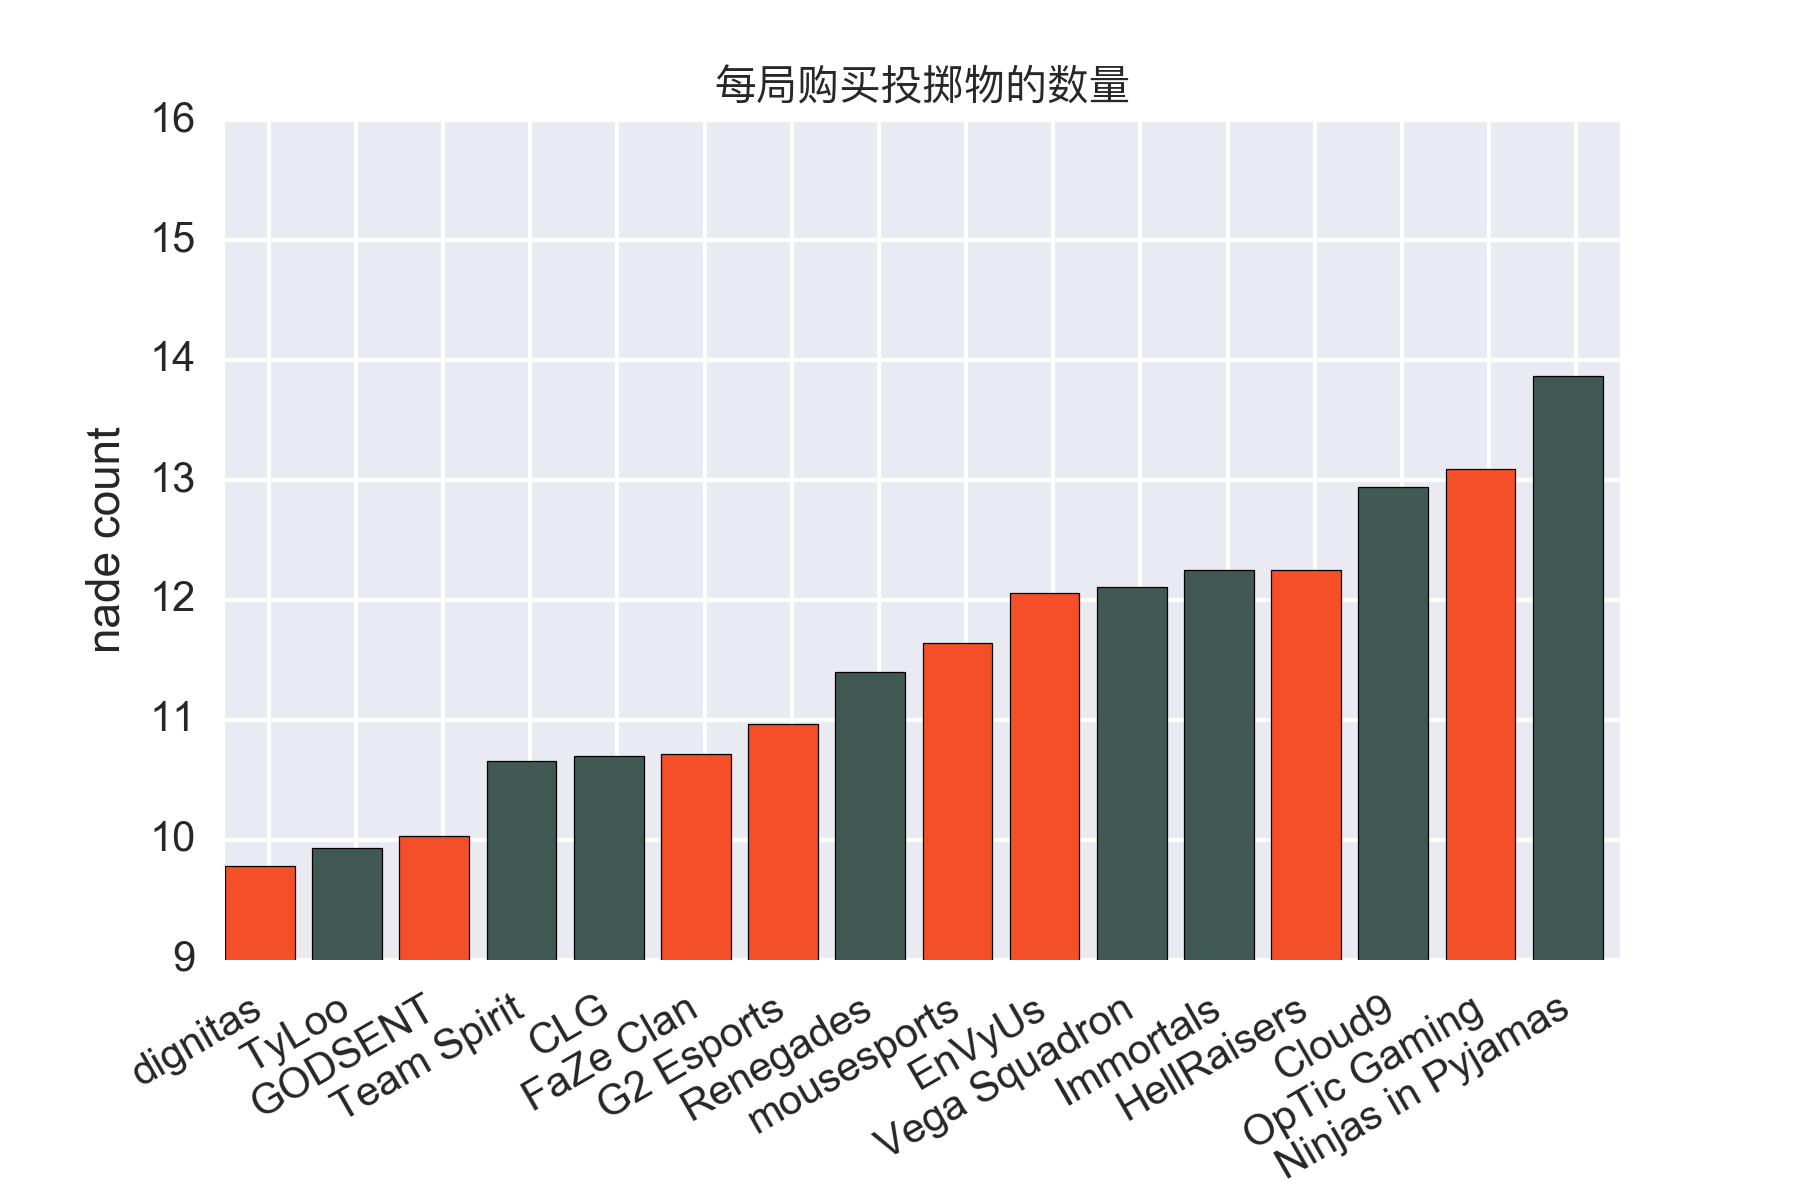
推荐字体
建议任何非演示,科学绘图,请不要使用Matplotlib。Echarts, D3.js这些Web based工具会对绘图提供极大便利,接下来的交互设置也容易很多。另外,使用CSS指定字体也会比Matplotlib中方便很多.